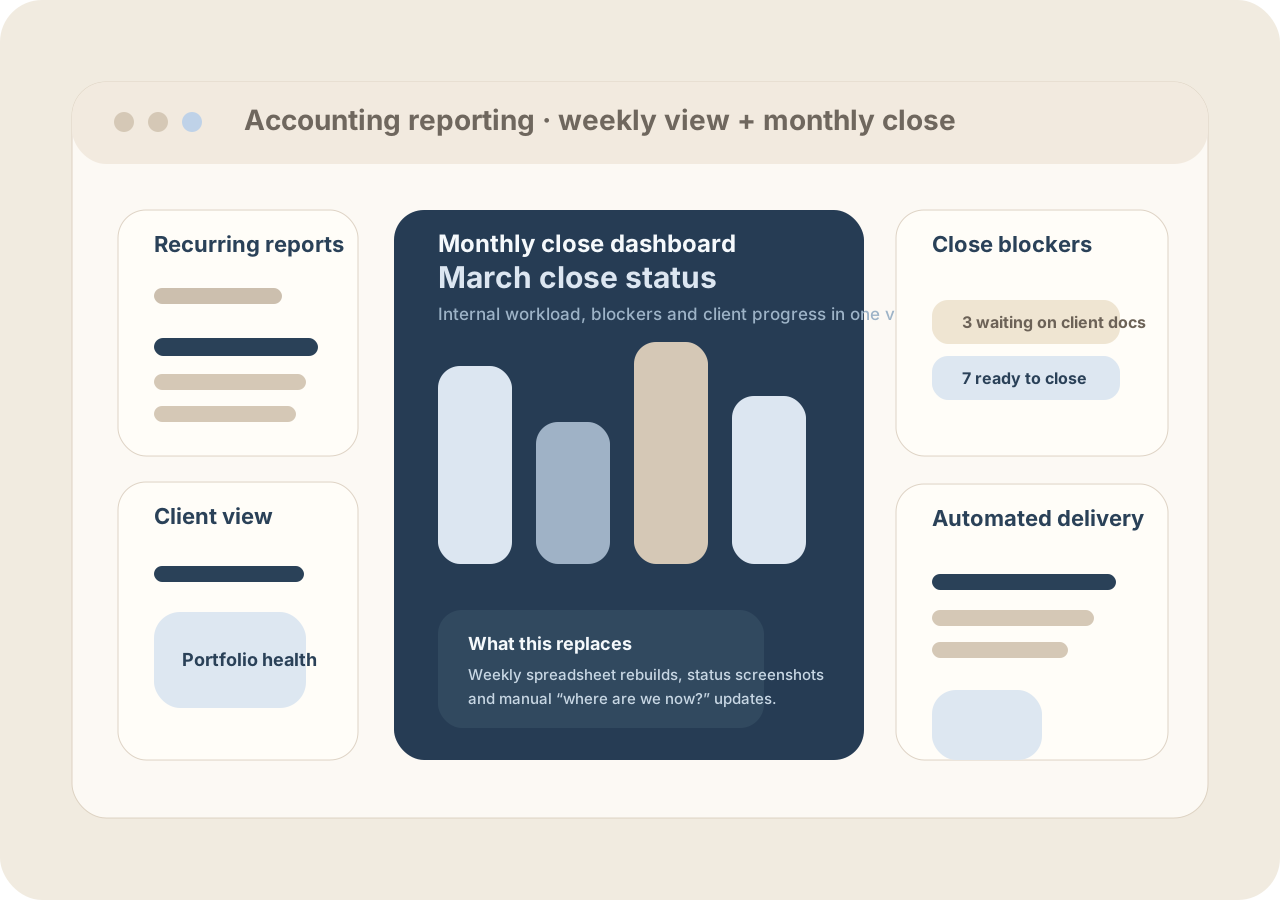
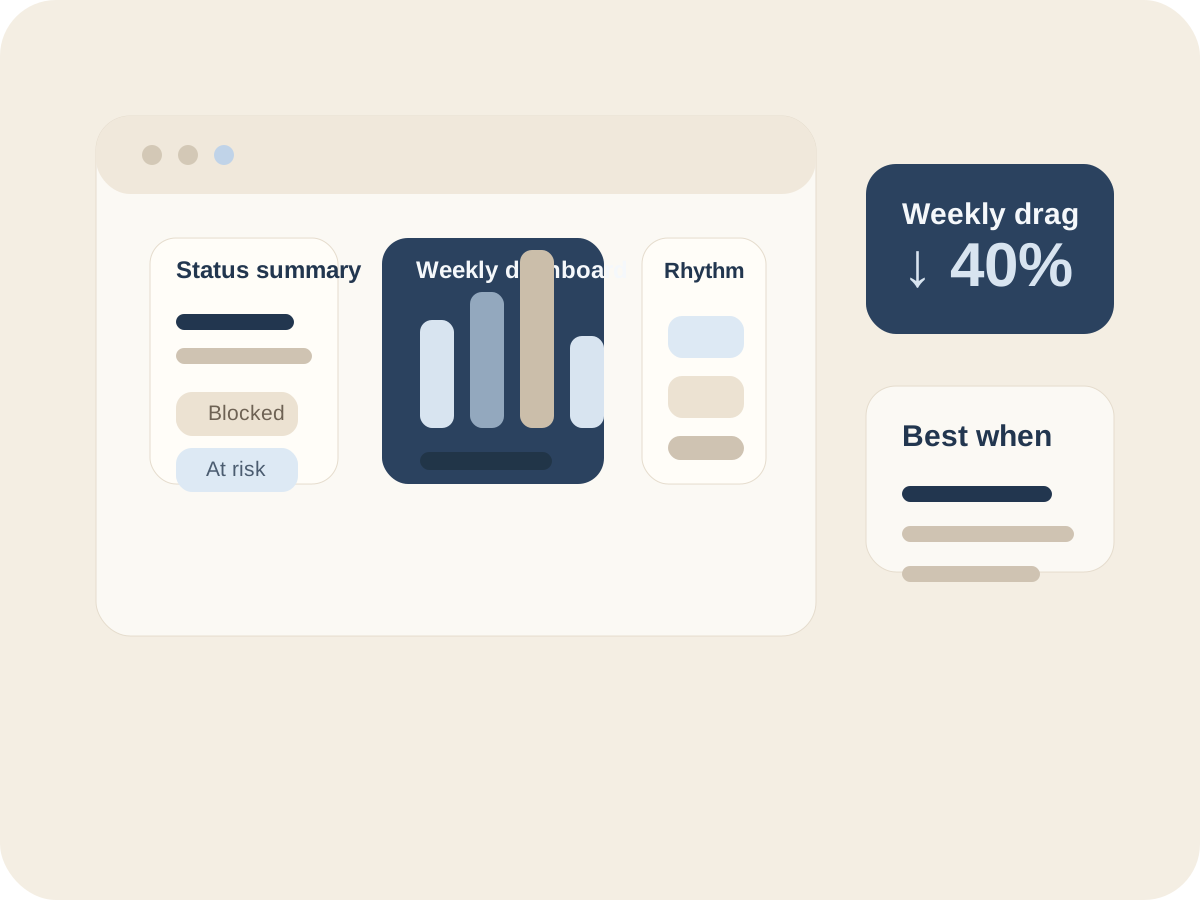
Status and workload
See what is active, what is overloaded and what needs action without digging across too many places.
Reporting dashboards
Mosel helps operations-heavy teams build dashboards around status, workload, bottlenecks, handoffs and repeated visibility work when the current overview still lives in spreadsheets, screenshots or too many status messages.
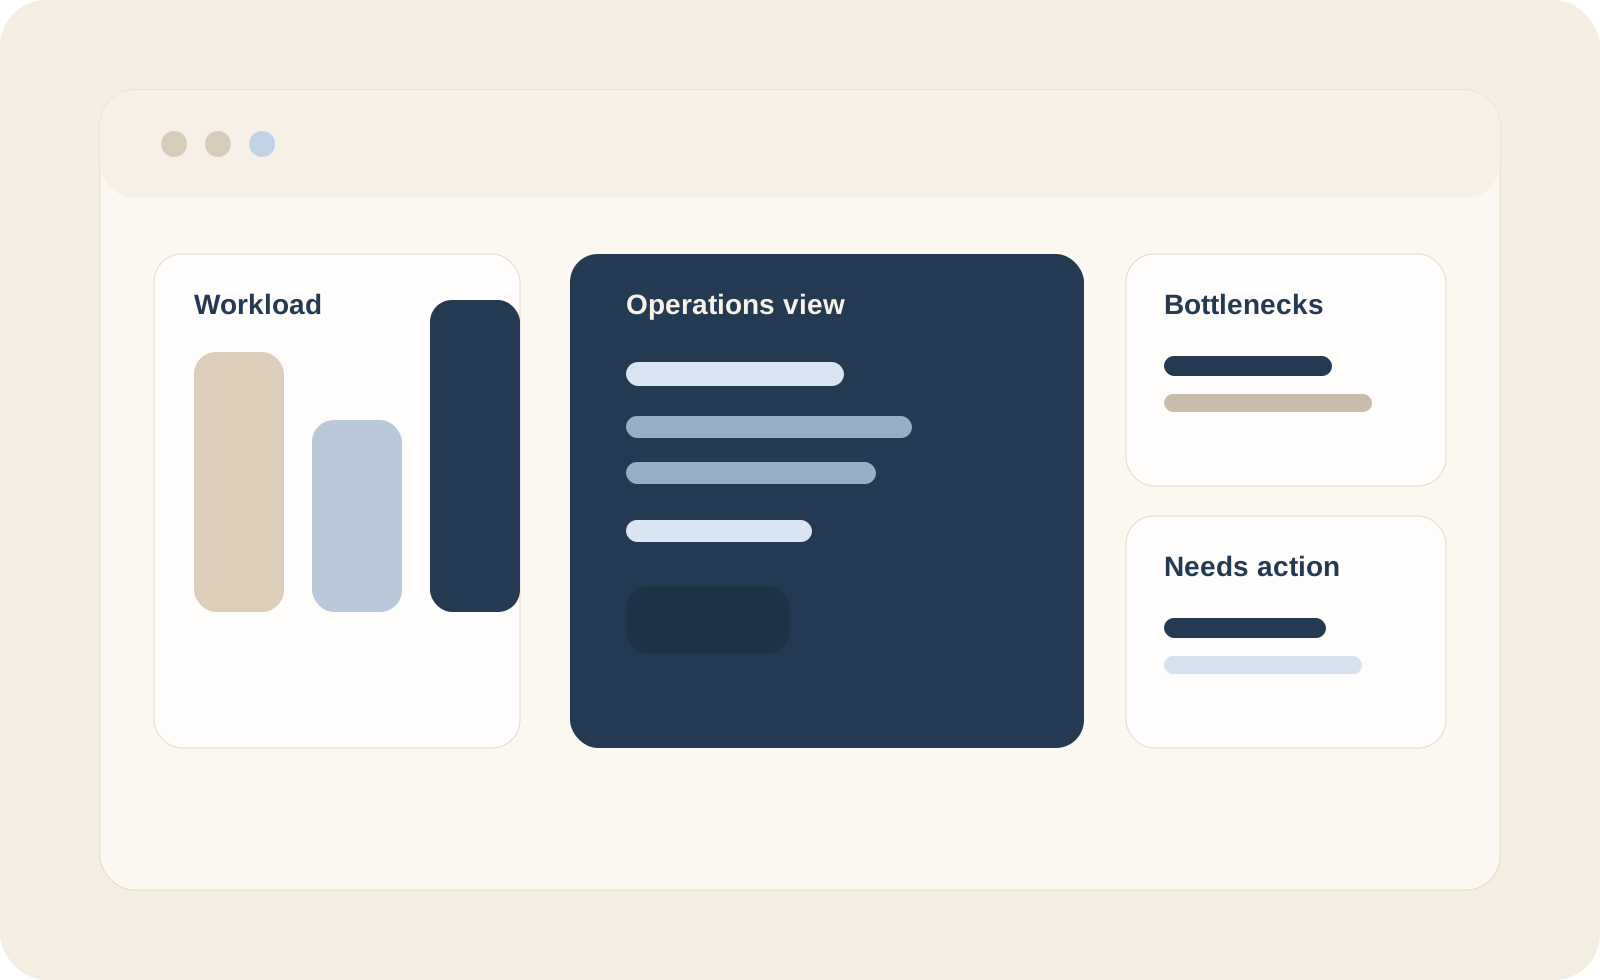
The team lacks one clear view of what is blocked, what is moving and where attention is needed next.
Important status still gets rebuilt manually in spreadsheets, Slack updates or screenshots.
A focused internal dashboard would save more time than another general-purpose reporting tool.
What this can include
See what is active, what is overloaded and what needs action without digging across too many places.
Make stuck work and repeated operational drag more obvious before it turns into larger delays.
Give the team a calmer way to decide what matters today instead of rebuilding the same overview again and again.
Keep the first version small enough to be used daily, not just admired once and forgotten.
How we approach it
We start with the operational overview the team keeps recreating or asking for over and over.
Usually the first useful version is one daily operations view around status, workload or bottlenecks.
Once the dashboard is used in practice, we refine the parts that make daily work clearer and cut the rest.
Good fit
This usually fits when the missing thing is not “more data”, but one calmer internal surface for what matters today, what is blocked and who should do the next move.
Usually sold as one focused operations dashboard first, then monthly refinement only if the team wants the view improved over time.
More specific pages
If this problem is close but not exact, one of these pages is usually the better starting point.